It is not always easy to predict a collapse of a financial bubble, but there often is something that indicates it in advance.
In the case of the subprime mortgage crisis in 2008, some famed fund managers such as George Soros or John Paulson knew it could be as serious as it eventually happened to be. This article explains the economic situations during the crisis and shows the statistics that preceded to imply the timing of the collapse of the stock markets.
The problem of the US property market
The crucial mistake the majority of the investors made in 2008 was to suppose that the problem was merely about the US property market and not about the US economy. It eventually proved, however, that it had to expand to the entire global economy.
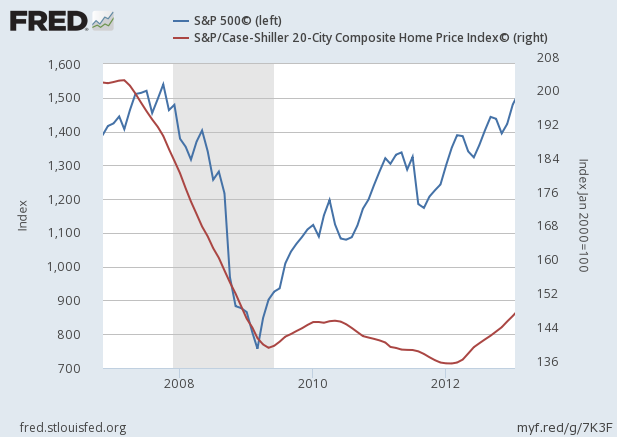
Thus investors at first ignored it when the house prices in the US started to decline. As the graph shows, the Case Shiller House Price Index peaked in March 2007, whilst S&P 500 did not start to collapse till October 2007.
So if you had been cautious enough, you could have avoided or even shorted the bubble, but when many of us are too used to the increase of the asset prices, just a few of us notice we should be vigilant. This is the first lesson from 2008.
The second lesson
There is not only one thing we could learn from the crisis, especially when we are too much dependent on the ability of the central banks.
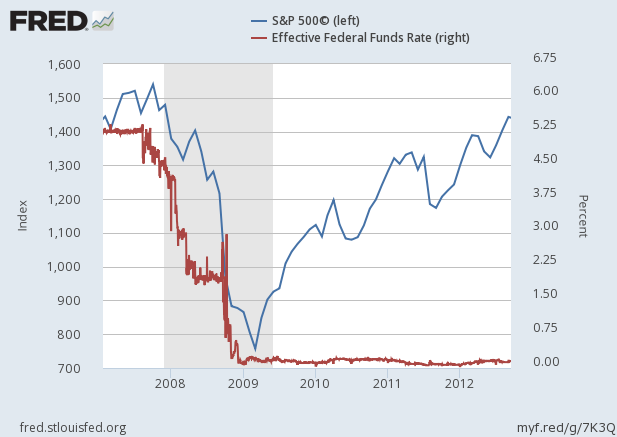
Did the Fed not make an action, so that the market crashed? The central bank actually made an action, quite aggressively, but the market crash, which had already started, could not be stopped. The following is the chart of S&P 500 and the federal funds rate:
Indeed, the Fed cut interest rates by 5.25% in 2007 and 2008, although during the period the US stock market just continued to fall.
What the Fed was thinking
The speech made in March 2007 by Janet Yellen, the current chairman and then San Francisco Federal Reserve President, explains what the Fed was thinking.
The FOMC has responded to these conditions by easing monetary policy substantially since September, cutting the federal funds rate by 3.25% to 2%. With core consumer inflation running at about the same rate, the real funds rate now stands at an accommodative level of around zero.
Yet obviously it was not sufficiently accommodative, and the Fed eventually had to cut rates by another 2% and even start quantitative easing in November 2008. The market finally rebounded from the bottom months after the start of QE.
Concluding remarks
Firstly, there was an indicator of the collapse that warned investors in advance, but investors ignored it. Secondly, the central bank’s actions could not save the situation immediately, and the bubble had to collapse.
It is not always easy to predict the exact peak of the bubble, but we should always be seeking the indicator that warns us correctly, and the central banks could save the markets in some occasions but in other occasions they could not. They are not almighty.
Amid the bubble created by massive QE by many central banks, we attempt to figure out how and when it ends and will continue to share our view here.

